


21 Mar 24
Web Design Statistics 2024 – Latest Website Statistics [UPDATED]
As director of a specialist website design & development agency for the last 12 years, we’ve definitely seen the website statistics which show momentous growth of digital, from conception to its now ubiquitous presence across all industries, in particular for 2024. Running a business nowadays is a whole different ball game with things like marketing, SEO, conversion-rate-optimisation and website design to also think about. No matter whether you are in Melbourne, Sydney, Brisbane or beyond, putting together a cohesive digital plan shouldn’t be based on guess-work.
To help you cover all bases, we’ve compiled a list of important and critical web-centric statistics for you to consider. Grab a coffee and enjoy some numbers that might even surprise you.
Regardless of whether you want to simply optimise your current website or build a whole new platform to scale with your evolving business, these website statistics & data will empower you with a more holistic perspective of the digital landscape in 2024 and beyond.
=== Eye-Opening Website Statistics ===

79% of companies admit that COVID-19 increased their budget for digital transformation
(Source : SuperOffice)
With lockdown affecting the globe, most spent the entire year spent indoors and predominantly online. The habit to spend more time online and on digital devices is a trend that doesn’t seem to be reversing as many have grown more comfortable or even reliant. In fact 79% of companies have been forced to increase spending on digital transformation post-pandemic.
[Latest website statistics] The average industry growth for web design services between 2018-2023 is 1.7% per year
(Source : IBIS World)
Digital has been surging in growth since the invention of computers and the release of the Internet almost 3 decades ago. However, as a direct result of the COVID-19 outbreak, web design is growing even more because many businesses and entrepreneurs are pushed to build and expand their online presence. It has been crucial for businesses to stay alive and connect with their consumers, with lockdowns and restrictions limiting conventional store interactions and physical shopping experiences.

There is around 5.35 billion active internet users worldwide
(Source : Statista)
A key pillar of modern communications, global internet usage has surged since it landed on public shores 3 decades ago. The growth of usage to about 5.35 billion is roughly around 66.2% of the global population. Of this total, 5.04 billion, or 62.3 percent of the world’s population, were social media users which is an important statistic to keep in mind for web design experiences that are prepared for sharing on social media such as open graph meta images and descriptions.
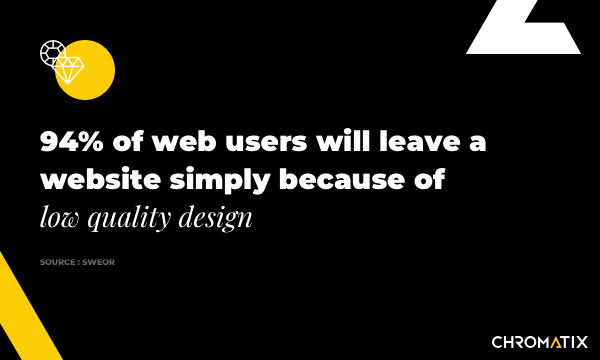
A visitor takes only 50 milliseconds (0.05 seconds) to form an opinion about your website, and decide whether they like it enough to stay or leave.
(Source : Taylor & Francis Online)
First impressions matter, so make it a good one. If your website does not resonate with your users, or if they find it overwhelming or loading too slow, they are likely to bounce off your website. In fact, 88% of online consumers are a lot less likely to return after a bad experience. In particular, millennials and Gen Z are a lot less forgiving of bad user experiences. With so many other options out there, it’s easy to not look back.
- Slow loading: 88.5%
- Non-responsive website: 73.1%
- Bad navigation: 61.5%
- Outdated design: 38.5%
- Poor content structure: 36.4%
- Obtrusive use of audio/video: 3.8%
41% of people will leave a website if images take too long to load
(Source : Adobe)
Website statistics show, people used to wait for months for pigeon carrier mail, but nowadays can send a text message instantaneously. It’s understandable online users are a lot more impatient these days.
Where is the average patience benchmark? A study showed that 53% of mobile visitors to a website left a website if it took them longer than 3 seconds to load. Slow loading websites lost retailers a staggering $2.6 billion in sales each year. Stay ahead of the game and ensure your website is optimised for speed.
- Images not loading (39%)
- Pages takes too long to load (39%)
- Page content is too long (38%)
- Content is visually unattractive (layout and imagery) (38%)
81% of customers search online before they make a purchase in a physical store
(Source : Major Purchase Shopper Study)
Customers want to know they’re getting the best deal or the best price. With a few clicks, users can open multiple websites to compare value. If your website is not up-to-date with your current in-store marketing campaigns or latest products, you may well be losing potential clients to your competitors.
What’s additionally interesting to note is that 9.6% of Gen Z shoppers and 31.4% of millennial shoppers say they purchase products in physical stores. If these age brackets compose most of your target market, it is even more important to ensure your website matches your brand accurately.
44% of users will stop engaging with a website that doesn’t provide the company’s contact information
(Source : Blue Corona)
It’s all about transparency and honesty these days. First-time visitors will trust in your company’s credibility a great deal more if they can easily find your phone number or address. Without this information, it’s harder to shake the subconscious doubts that your company is run in a backyard or overseas where you might just disappear.

57% of internet users say they won’t recommend a business with a poorly designed website on mobile
(Source : SocPub)
A poorly functioning or visually unappealing website doesn’t just hurt your current sales. It also curbs the potential to grow your business as you lose the organic growth from word-of-mouth referrals.

Given 15 minutes to consume content, 2/3rds of people would rather read something beautifully designed than something plain
(Source : Adobe)
There’s no denying that people are very visually dependent, as it is the most used out of the 5 senses we have. In fact, 89% of people around the world will actually switch devices or stop viewing altogether with a website when coming across content issues.

=== Usability & User Experience Website Statistics ===
70% of people read through content if there are clear bullet points, compared to 55% looking at lists without bullet points
(Source : Nielsen Norman Group)
Content design (headlines & copy) is as important as visual design. There’s no point writing long paragraphs if it deters people from reading it. Breaking up your content into digestible chunks allow people to skim through your content and anchor their eyes to the parts that are relevant to them.
66% of customers will use multiple devices to begin and complete an online transaction
(Source : Salesforce)
It’s extremely normal for users to jump onto your website from a quick on-the-go Google search, bounce off your website and then check you out again later in bed on their laptop. It’s important now, more than ever to ensure your web experiences are seamless and consistent across all devices, from mobile to desktop.
The average website session duration is 1 minutes, 17 seconds for B2B and 1 minute, 32 seconds for B2C
(Source : Databox)
Pretty tight for a standard in-person pitch right? How does your website average session duration compare? To increase your session duration, you can optimise your content to be more engaging and interactive.
=== Conversion Website Statistics ===
According to industry research, 69% of website content is never seen by visitors
(Source : Contentsquare)
Less is more when it comes to website copy. The average attention span of users has dropped from 12 seconds to 7 seconds nowadays. There are more skimmers than swimmers these days. So avoid deal-breakers like long paragraphs or jargon-heavy copy.
Just show the best bits of your business on your website.
A 0.1 second decrease in load time can significantly improve a website’s overall performance
(Source : Deloitte Digital)
Change does not have to be drastic to have big impacts in conversion. Deloitte studies websites across a range of industries and found a minute 0.1 second improvement in load speeds saw
- 8% to 10% more conversions
- 10% more money spent on the average order
- 7% to 8% more pages viewed
- Product page bounce rates improved by 5%
- E-commerce customer engagement increased by 5%
The average website conversion rate is 2.35%
(Source : ImpactPlus)
It might sound low, but if your analytics are sitting around this mark, you’re doing well. Of course, general conversion averages also differ within each industry, from the varied mindsets of the consumers.
- Sporting goods – 2.35%
- Home and garden – 3.27%
- Apparel and accessories – 3.50%
- Electronics – 3.50%
- Health and beauty – 3.80%
- Food, beverages and tobacco – 4.95%
From analysing 100,000 page views, Clicktale found that only 22% of users scrolled all the way to the bottom
(Source : ContentSquare)
That’s an unfortunate sum of 78,000 people who might have missed the phone number or contact form. Whilst users are comfortable with endless scroll on social media platforms such as Tik Tok, Facebook and Instagram, user behaviours are very different when it comes to websites. Reading long chunks of text can be overwhelming, especially if it’s not categorised or organised well.
Websites with active blogs have 434% more indexed pages than competitors
(Source : TechClient)
The quality content you wrote years ago can still work to boost your SEO and organic Google traffic in this current day. Google bots actively crawl every single page of your website to find good and relevant matches to users’ search queries. Maintaining an active blog increases your chance of multiple pages to be picked up and shown on the first page of Google.
Bottom line – if you can rank for more than just your landing pages, why wouldn’t you?

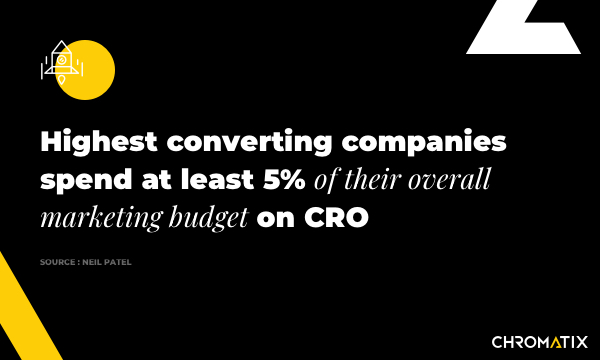
Top converting companies spend at least 5% of their budget on CRO
(Source : Adobe)
Most companies spend $1 on conversion rate optimisation for every $92 they spend on customer acquisition. However, the top companies understand it makes more sense to fix a leaky bucket than to keep pouring water into it.
Our recommended order of affairs is to optimise the conversion rate of your website, before you spend on increasing your traffic to it.
Websites with 40+ landing pages generate 12x more leads
(Source : Adjossible)
Website statistics show that there’s no need to be shy or to hold back with the number of landing pages on your website. The more relevant your landing pages in their user or product specificities, the wider the net you cast in the Google search pool.

Videos increase landing page conversions by 86%
(Source : Eyeviewdigital)
There’s no denying people love video content, with users favouring short-form video clips across all the giant social networks, from YouTube to Facebook and especially evinced by the latest gigantic rise of Tik Tok.
Having a video on your landing page allows your users to instantly connect with your brand and message in a much faster and engaging way. It was found that a shopper who watches a video is nearly 2x times more likely to convert than a shopper who doesn’t.
=== Responsive Mobile Website Statistics ===
72% of retail site visits in the USA are from smartphones
(Source : Bigcommerce)
Viral marketing campaigns such as Black Friday, Cyber Monday, Click Frenzy and Thanksgiving Day show the strength of strong mobile marketing. Although traditionally preferred for browsing, 46.6% of smartphone users and 7.7% of tablet users completed sales transactions across these sales.
Deloitte predicted that mobile will account for 75% of all digital commerce sales in 2023, so it is crucial that your website is optimised for mobile and desktop.
The average person spends 70% of their digital media time on a mobile device
(Source : Orberlo)
A decent chunk of screen time is spent browsing through social media channels, jumping from Instagram to Facebook to Tik Tok and then even their emails. Every one of these journey points present promoted ads which can bring consumers directly to your website. Even when users don’t have serious buying intent, it is important to make a good impression with a true responsive website, as a positive web experience will nurture their desire to engage with your brand.
53% of smartphone users surveyed say they feel more favourable towards websites and companies that offer video instructions about products or services
(Source : AIMultiple)
With video dominating most social media newsfeeds, it’s understandable it’s become a media staple that users are comfortable with and prefer. In fact, 45% of online users watch an hour or more of videos from Facebook and/or YouTube each week. Brands that provide video come across more authentic to their users. Video content with in-situ product demonstration and user testimonial content are highly valued by users when making buying decisions.
