


10 Jun 22
UA vs GA4 – What Is GA4 and Why It Matters
What is GA4 and Why Should I Care?
Google Analytics 4 (GA4) is the new analytics tracking software released by Google to replace Universal Analytics on 1 Jul 2023. If you have been tracking activity on your website before Oct 2020 (date of GA4 launch), chances are
- You will be on Universal Analytics and Universal Analytics WILL stop working after 1 Jul 2023. Refer to Google Announcement here.
- To have comparative data next financial year, you would need to start implementing GA4 as early as 1 Jul 2022 as the migration of data from UA to GA4 IS NOT automatic.
That, as of the date of the publishing of this article, is less than a month away.
Why GA4?
To understand why anything. You first need to understand the context.
| Universal Analytics (2012) was created at a time when: | In response, Universal Analytics: | Over the years: | In response, Google had to: |
|---|---|---|---|
|
|
|
|
|
|
|
|
|
|
|
|
Which was why the App + Web feature came into Universal Analytics. While businesses previously needed two platforms (GA and Firebase) to analyze both app and web, App + Web aims to unify the reporting between app and web instances. That feature later became rebranded as Google Analytics 4.
What Imagery Should I Think of When Thinking About UA and GA4?
Don’t understand what this question is about? I am going to make understanding the transition from UA to GA4 much easier by using 2 sets of imagery:
- The rocket ship
- The tricycle & the bicycle
Hear me out.
Let’s look at the following pre-defined report from UA: The age demographic report (showing age ranges of visitors visiting your site)
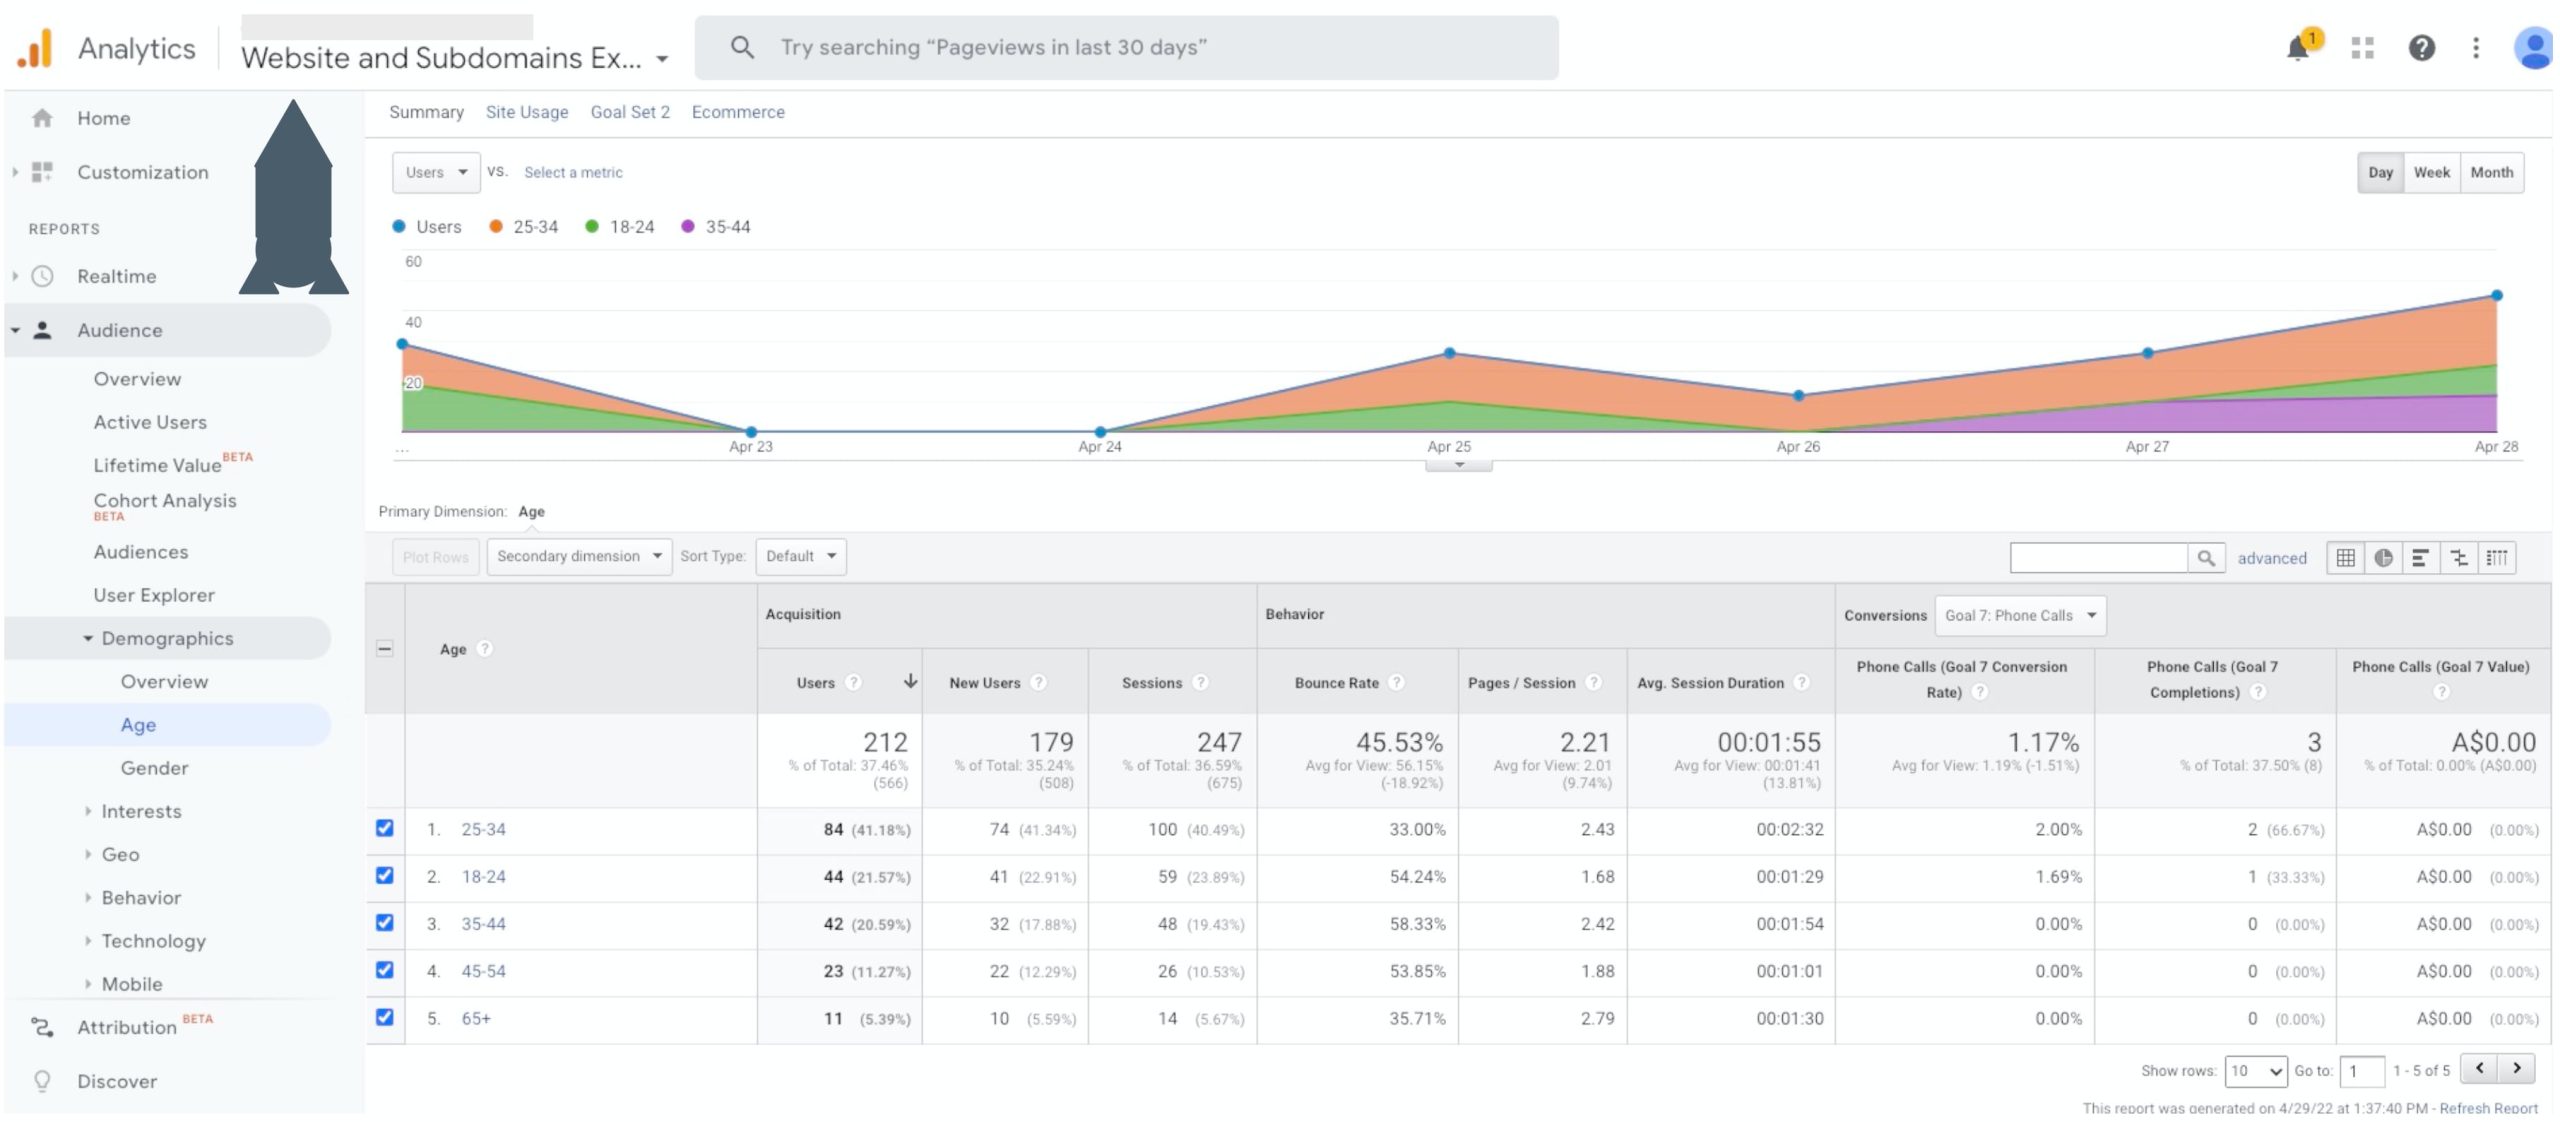
If you are wondering what that dark grey shape is in the corner, it’s a rocket ship. That’s what the ready-made reports in UA are like. They are reports tied into relevant dimensions and metrics: feats of engineering already done for you. All you have to do is:
- To click on the report and read it
- BUT there is a lot of columns on that table for you to read and interpret.
And how many pre-defined reports does UA have for you to go through? Over 100 reports. It’s like Google is trying to encourage businesses to use the bicycle, by giving them a tricycle. Don’t know what reports to use? Here’s one that might help. Not working? Try this one!
That is a LOT of data. Too much perhaps. This begs the question of:
- Which of these 100 reports actually help you with your business decisions?
- Even if you do make a decision off from one of these reports, did you interpret the data correctly in the first place?
- With privacy regulations getting stricter, are you retaining information about your user that is potentially illegal (e.g. Amazon got fined 35 million Euros in France after failing to get cookie consent)
Which is why Google Analytics had to change to deal with this problem.
What Google Analytics Changed
If you look at the rocket ship, it’s made up of these components/blocks.
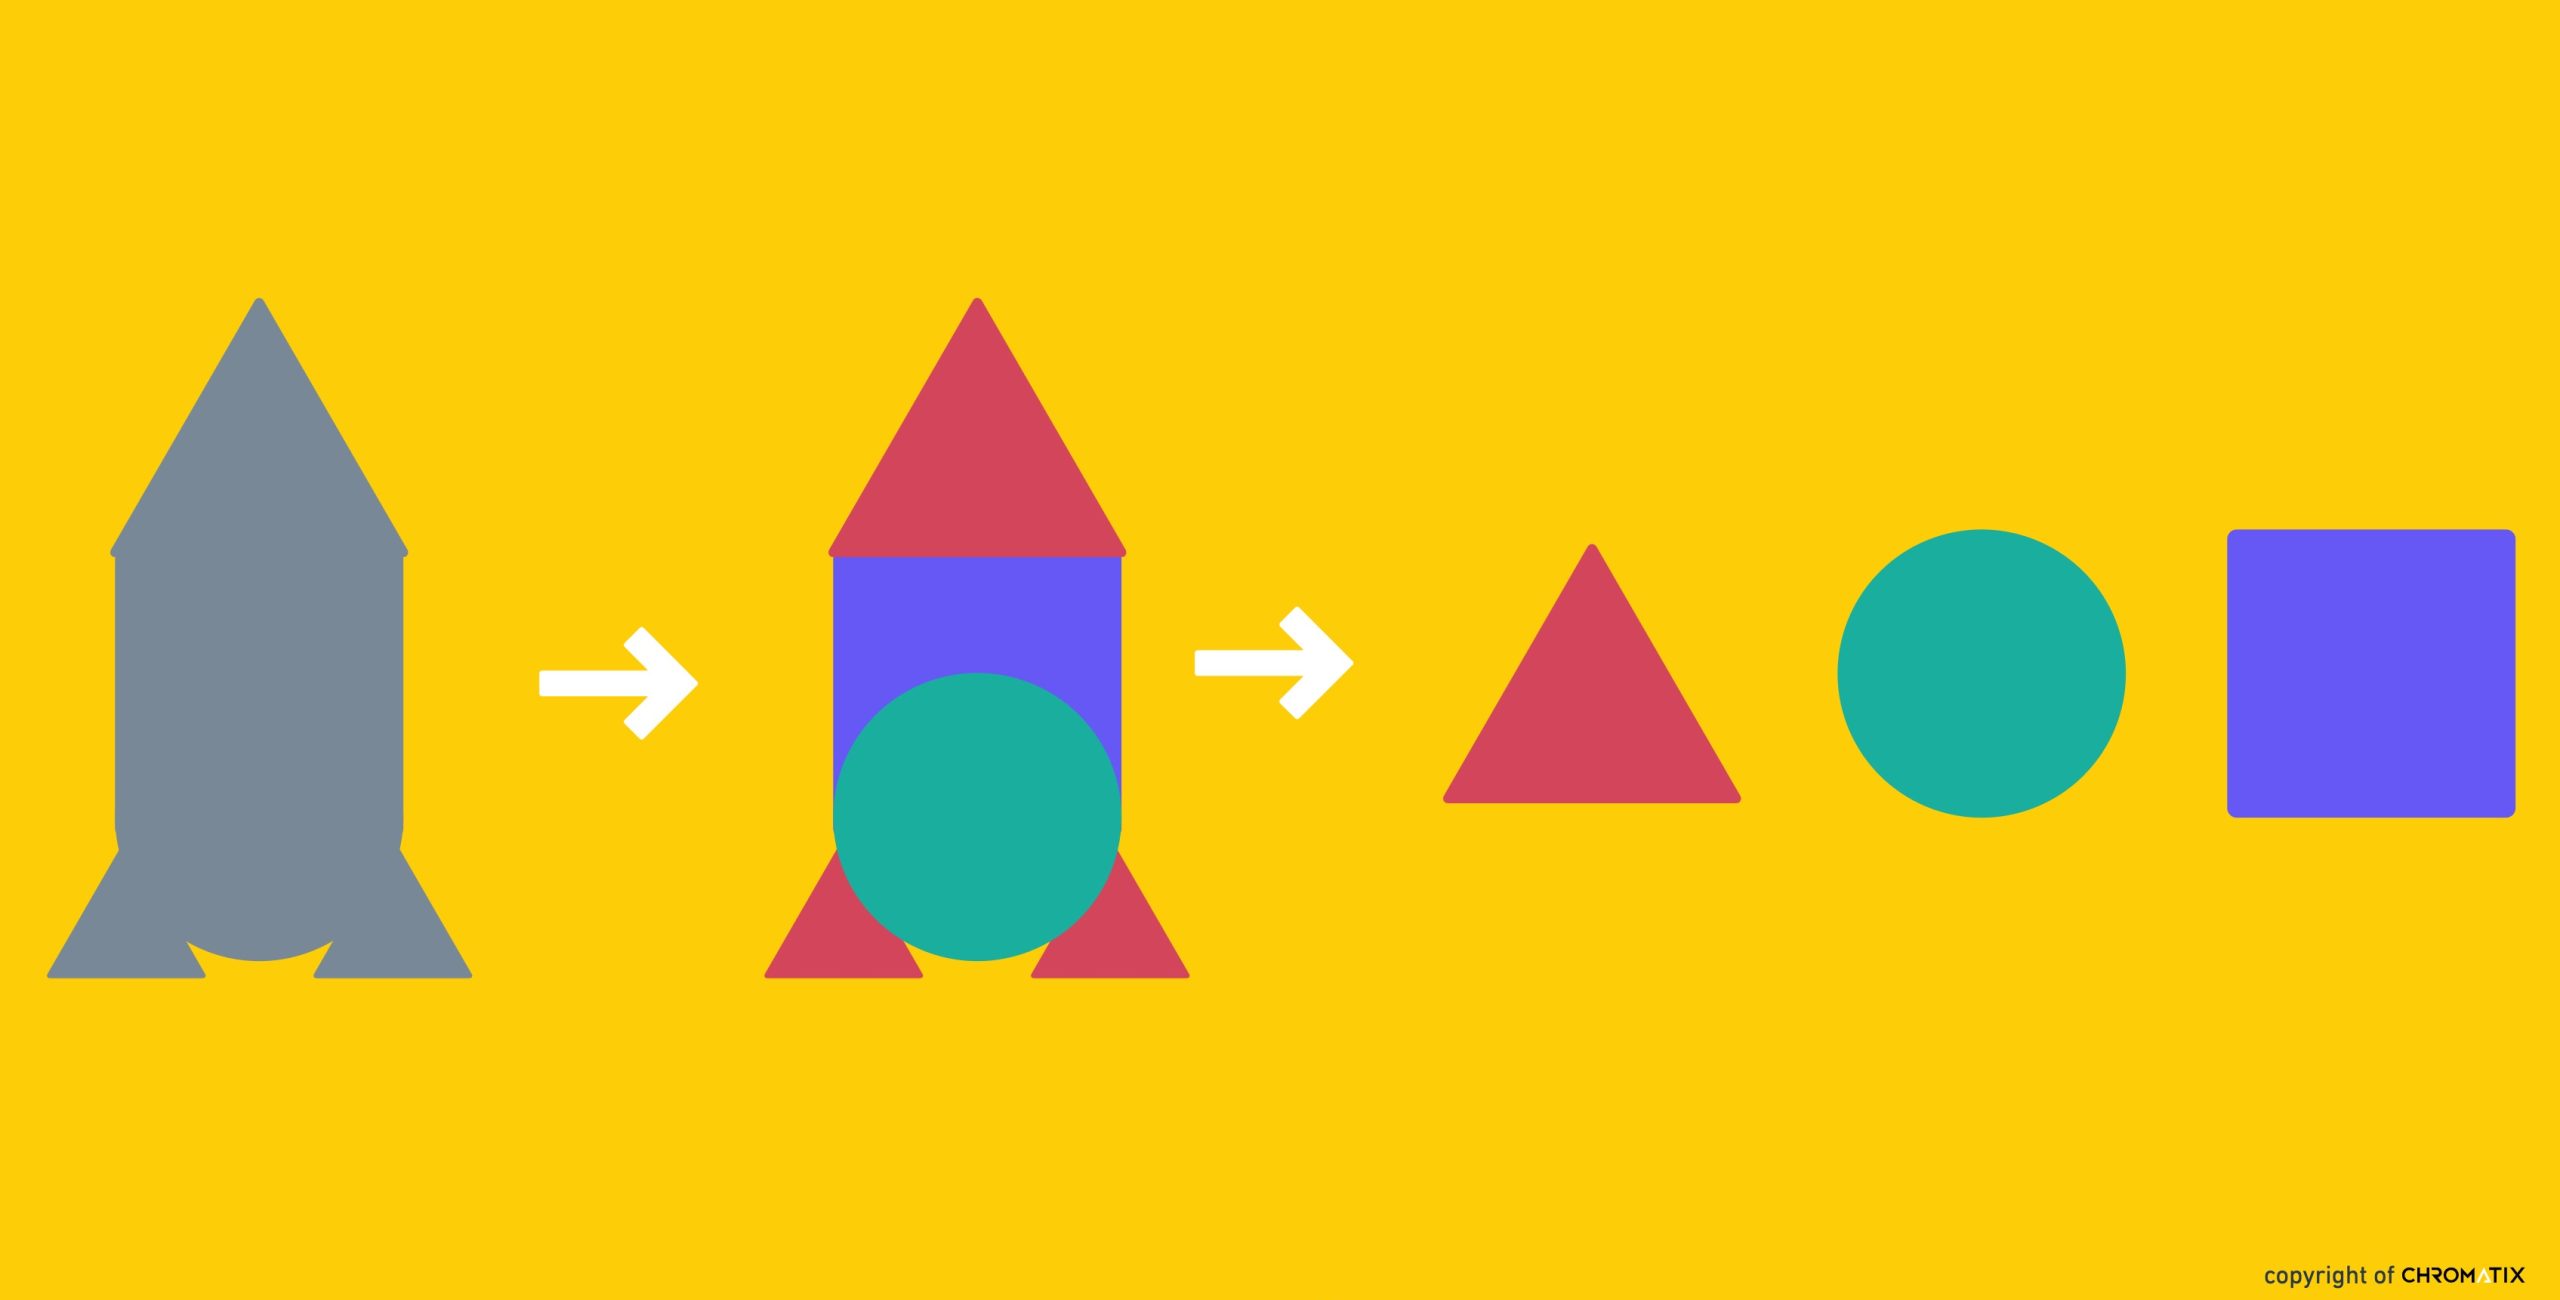
They gave us the building blocks, so we can build our own rocket ship.
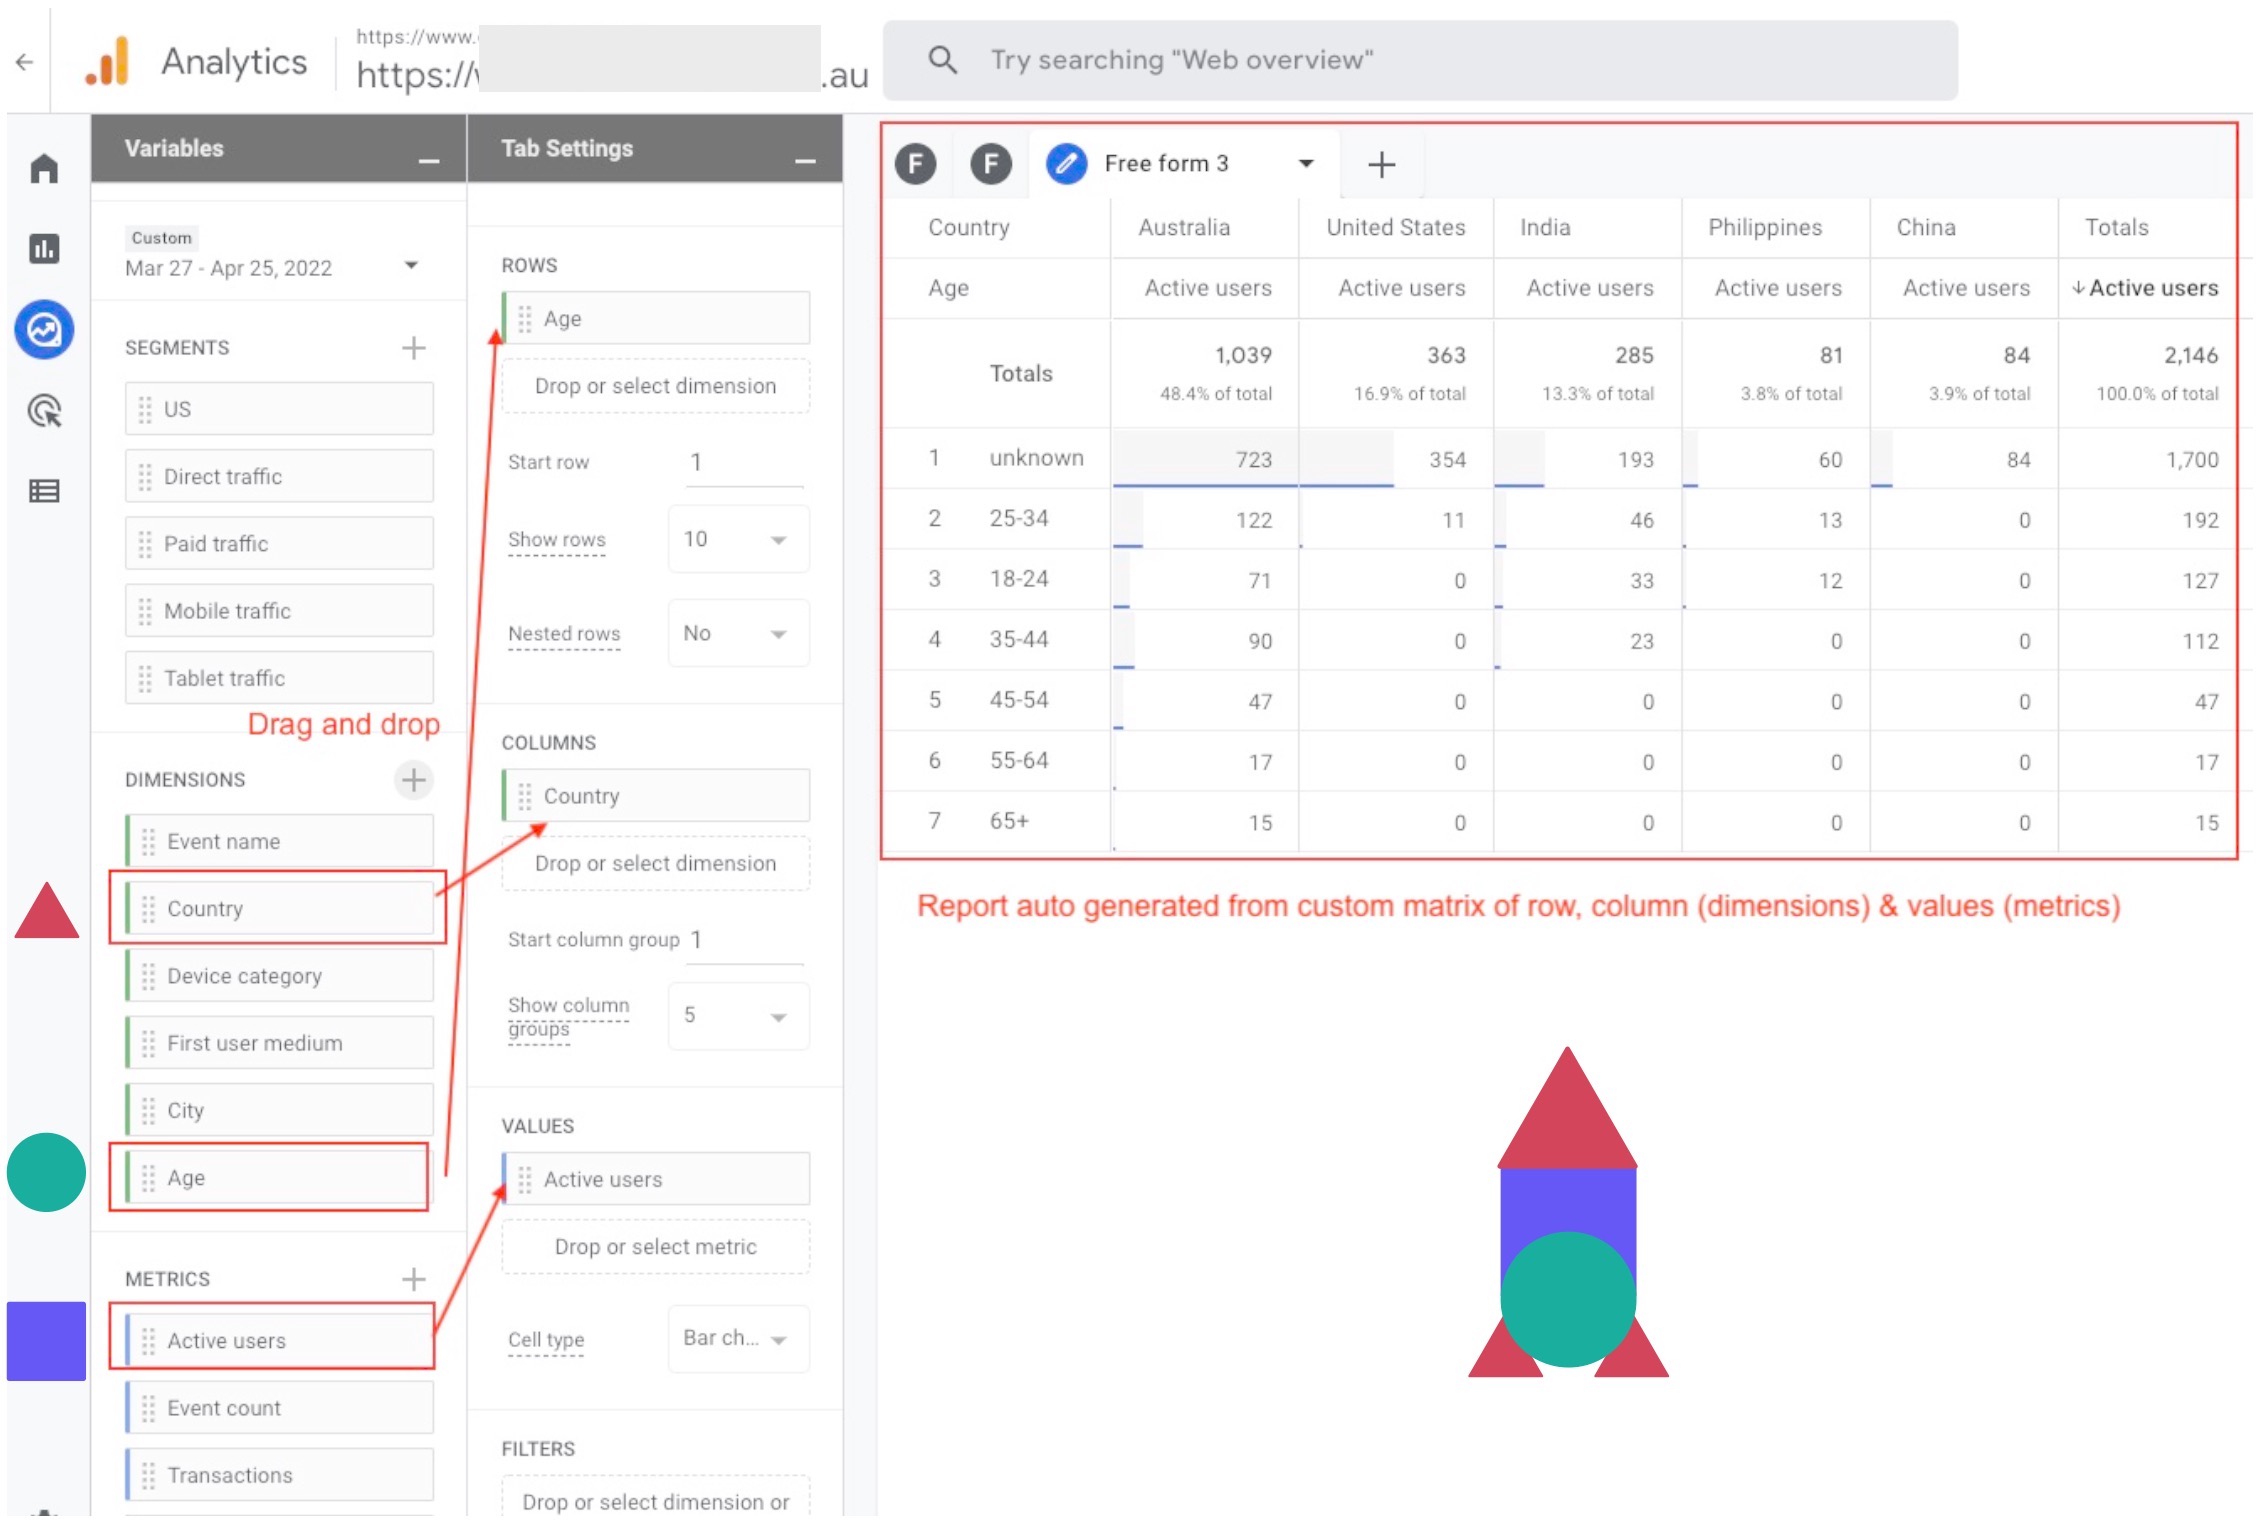
In GA4, there is an entire section dedicated to report making called Explore. In there, you can pretty much create any report you want from combining your own dimensions and metrics by dragging and dropping.
By giving businesses the power to build their own reports:
- It forces owners to think about what data matters to their decision making
- With access to developers being easier than ever, think about what data you want to capture to feed those dimensions and metrics that make up your custom report (if not automatically captured)
- Through the exercise above, you have more control over what data is stored on your server, reducing your risk of privacy breaches. GA4 also gives you the power to delete those breaches.
Google has decided that most businesses are now ready to take off their training wheels, and ride that bicycle!
And that, by the way, is the segue to the first key difference between GA4 and UA: Reduced number of ready made reports in favour of custom reports.
For those of you who are so technically inclined, you can read more about the 5 key differences between GA4 and UA in this article here, which is part of our GA4 series of articles.
Aim for Trends, Not 100% Sampling
GA4’s default setting for every user will be to anonymise their IP, whilst this was optional in UA. What this means is that although you can track their actions on your website, you will not be able to get demographical data about the user, such as their age, sex and interests. In order for you to be able to get these data from GA4, the following conditions must be met:
- Google Signals must be turned on in GA4 (It’s turned off by default. To find out how to activate it in GA4, click here)
- The user must have consented on Google to have Ad Personalisation turned on
What the above would mean is that whilst you have been enjoying getting a high degree of sampling: Say, if you had 100 visitors on your landing page, UA will tell you that:
- 80 of them were women and
- 20 of them were men,
you would know that your next marketing decision would be to target women in your campaigns using the landing page.
In GA4, for the same data, you may get 60% who left the default ‘yes’ on their Google Account for ad personalisation. GA4 will tell you that:
- 47 of them were women and
- 13 of them were men
- 40 are undefined
that still would not change your marketing decision to target women in your campaigns as Google Signals would have allowed you sufficient data to identify a trend.
What Should I Do?
If you have a UA tag on your website:
- Create a GA4 tag for your website if you haven’t already, at least by 1 Jul 2022. That way, you will have a full year of comparative data by 1 Jul 2023 when your UA tag stops working.
- Recreate the reports from UA with the custom report building functionality offered in GA4. Don’t recreate all reports, only the ones that you rely on to make your business decisions. Take it as an opportunity to reassess.
- Have your UA tag and your GA4 tag work concurrently over the next year. Compare the results of the reports in UA and the one you made in GA4.
- Note any significant differences from 3 and you can try to work with your Marketing team to understand what is causing the difference to understand your report better (eg. perhaps it’s the session timeout setting that’s making the sessions in UA seem more than sessions recorded in GA4).
If you have NO tagging on your website:
- Work out how your website will help support your business goals (eg. more sales)
- Figure out how to measure that your website is supporting your business goal (eg. more enquiries about your product/service)
- Set some realistic targets/KPIs (eg. For every 100 new visitors, I want to get 5 enquiries on my product. Conversion = 5%) that you want to achieve
- Repeat steps 1 to 4 for several other key events that you want to track and you will end up with a measurement plan of events you would like to track from your website
- Hand that list over to your Marketing team so that they can create those events for/with you once they have set up GA4 tagging on your site.
If you are stuck at any of the above, feel free to give us a call on +61 3 9912 6403 and we can step you through it. Besides our award winning web designs and development, we are also conversion design experts and can help optimise your site to perform, both visually and functionally. Want to know more about differences between UA and GA4? Find out more here.
